Piktochart is an infographic and presentation tool enabling you to turn boring data into engaging infographics with just a few clicks. Piktochart's customizable editor lets you do things like modify colour schemes and fonts, insert pre-loaded graphics and upload basic shapes and images. Its grid lined templates also make it easy to align graphical elements and resize images proportionally. There's a free version offering three basic themes, while a pro account costs $29 per month or $169 for a year.
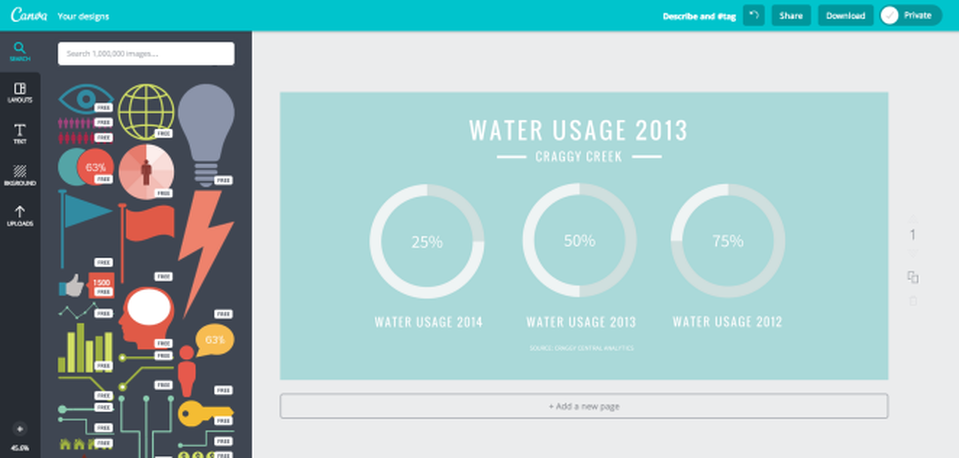
Canva has a large set of icons, pictures and assets for you to choose from (and many of them are free). It is also a more powerful than most tools, although the learning curve might be a little challenging. The overall creating experience is also not as responsive as Piktochart.
As its name implies, Infogr.am is specialized in creating infograms and charts. The site has a large number of chart templates with more than 20 new data visualization formats from the simple like pie charts and graphs to the complex like multi-layer data-grids. With a built-in spreadsheet engine and simple drag-and-drop interface, an infographic can be created and embedded on a page or shared as a link or an image directly. Uldis Leiterts, Founder, says the sites supports data import from XLS and CSV.
Vennage is a pretty new member to the party. Although it offers little to none features that are superior to those mentioned above, some people might find working with Vennage a little more pleasing with its unique design. And more importantly, it gets the job done.
